Note: This article was originally written on October 27, 2015 and it has been updated to reflect all data from 2015 now that it’s in. To request a full copy of the report https://investingarchitect.com/contact-us or if you’re viewing this in your email, please hit reply.
—
“Are we here yet?”
A concerned Investing Architect client asked me that question out of the blue. In his email he sent a link to a BiggerPockets article (link in the footnotes) that warned about the risk of over saturation in certain rental markets (i.e Atlanta, GA).
In essence, over saturation occurs when there is an imbalance in the rental market caused by excessive supply. Basically, too many properties for lease and not enough tenant demand to lease them all. As a result, days on market increase significantly and there’s substantial downward pressure on rents. In these market conditions, tenants have increased leverage to negotiate lower prices (due to availability) and investors are eager to lower rents to fill vacancies. Not matter how you look at it, over saturation is bad news for long term real estate investors.
Back to the question that started it all: Is the Houston rental market experiencing over saturation? We can answer this question two different ways: 1) Blurt out a short answer that fits our existing opinions or 2) Look at empirical data and let it answer the question unequivocally.
When in doubt, LOOK AT DATA!
Methodology and Criteria
As we set on this journey to satisfy our common deeply-held nerd cravings for numbers, we had to use a clear methodology so the conclusions could lead us to meaningful answers.
First, we were only interested in “investment grade properties” single family homes that are zoned to great school districts, built after 2000, between 1500-3000sf, with at least 3 bedrooms and 2 baths. Further, we wanted to focus our search on properties leased for 12 months or more – so, no short term leases – and no subsidized Section 8 leases.
Next, we organized the data by school district (instead of lumping it all into one big pile) and focused our attention on four metrics: Number of units leased, Average rent, Median Rent and Days on Market.
Further, we did a side-by-side, year over year comparison for those four metrics for each month as well as on an annual basis.
Last but not least, we used the findings to project current absorption rates and inventory levels for each school district to give us forward looking perspective of the rental market in those locations.
Needless to say, the findings didn’t disappoint.

Study Results
Once we crunched the numbers, some interesting patterns emerged. Here are some of the most important ones:
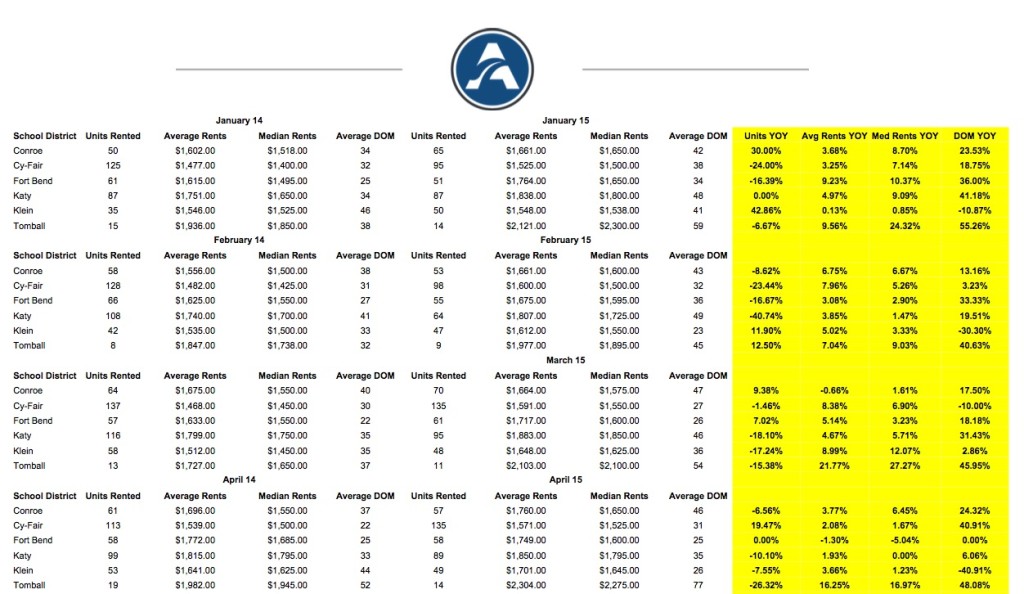
- Annually, Units Rented were up an average of 1.47%. In fact they were either higher or flat in all school districts except Katy ISD which saw an 11.5% decline. On the flipside, Klein ISD saw the sharpest increase in units leased which soared 13.2%.
- Annually, Average Rents rose by an average of 4.27% . Median Rents rose by an average of 5.17%. In both categories, Klein and Tomball ISD properties posted the highest gains.
- Annually, Days on Market rose by an average of 21%. Katy and Cy-Fair ISD had the highest increase at 36% and 27% respectively.
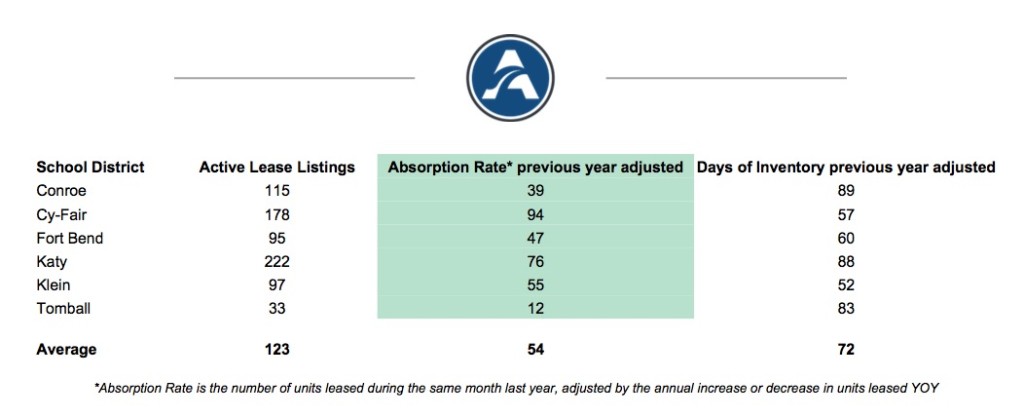
To get a sense for how the market might behave going forward, we “weighed” the current number of listings active on the market for each school district against the adjusted absorption rate (the number of properties leased this month last year adjusted by the annual year over year increase or decrease in overall units leased). That provides a crucial metric for the health of a rental market (Days of Inventory) which in a nutshell tells you how many days it would take to clear out all existing inventory for lease based on last year’s adjusted absorption rate.
As of the date of this writing, there were an average of 123 listings on the market with an absorption rate of 54 properties per month. That tells us there are 72 days worth of inventory currently on the market.

Study Conclusions
So what does it all mean and what’s the answer to the question that started the nerd avalanche?
- The Houston rental market is NOT experiencing over saturation. The fact that units leased and rents are up year over year is a testament to that simple truth.
- Having said that, the market balance is shifting from an overwhelmingly landlord-friendly market to a more balanced market, as more properties have become available. That is being reflected in the increase in days on market for investment grade properties for lease. This will result in more competition for tenants so rents will probably not rise at the same clip going forward.
- The days of putting your investment property on the market and having multiple lease applications within the first week may be behind us. Therefore, investors must adapt their expectations, and most importantly their projections, to the new market realities of longer days on market.
- The filters we used to compile the data eliminate all properties and locations that don’t fit general “investment grade” criteria. However, the properties we present to our clients as acquisition targets are only a small fraction of this filtered list. The creme de la creme, if you will. As always, the best locations and properties outperform their less than excellent peers.
- As much as we tried to segment the market (using school districts), I’m afraid the segmentation isn’t granular enough. For example, within Cy Fair ISD there are pockets, neighborhoods, zip codes that behave differently than other counterparts within the same district. Therefore, this analysis isn’t meant as a substitute for neighborhood level analysis that tells a clearer story about what’s going on in that neighborhood. The study is a 10,000ft view to look for general patterns – property specific market analysis is the microscope view.
We will continue to keep a watchful eye on the Houston rental market in order to provide you with the insight and strategies to make smarter long term real estate investments.
—
If you’re interested in a PDF report of the study (and a Google Spreadsheet file if you’d like to play with the numbers) contact us or if you’re reading this in your email, just hit reply.
Footnotes:
The Pivotal Factor You Probably Don’t Know to Watch for in a Rental Market – http://www.biggerpockets.com/renewsblog/2015/01/19/pivotal-factor-rental-market/
BiggerPockets, January 2015
Erion, another excellent post. I appreciate the focus on data and analysis to assess the rental situation in Houston. From one data geek to another I applaud the approach.
As the “concerned client”, I completely agree with your assessment – there does not appear to be over-saturation in the Houston rental market, but it’s worth keeping an eye on. A few quick, random thoughts:
1) Some of these metrics are leading indicators and some are lagging. Days of Inventory -> Days on Market -> Rental Price. Days of Inventory, specifically the trend direction, may be the proverbial canary and will be helpful to assess and inform investment decisions.
2) Vacancy is a ROI killer. Planning for tenant turnover – and marketing the rental as soon as possible – will be important to maintain one’s profits.
3) Interest Rates need to increase. Supply of new rentals is being driven by cheap access to cash. As long as the Fed keeps the spigot open, the balloon will fill.
Thanks again, Erion.