Essential real estate investing lesson learned from Starbucks
Do you ever wonder about the decision making process that a company like Starbucks goes through when deciding where to put their new store? Think about it for a second. Opening a new store involves tremendous costs: hundreds of thousands spent on building out the store, millions of dollars committed to a long term lease and thousands of man hours spent on hiring and training the new staff. Needless to say, it’s a pretty big decision that the company HAS to get right. But as any commercial real estate broker will tell you, every retail space owner wants to lease to Starbucks. So with all these options at their disposal, on what do they base their decision? Do they just wing it or “play it by the gut”? Not a chance.
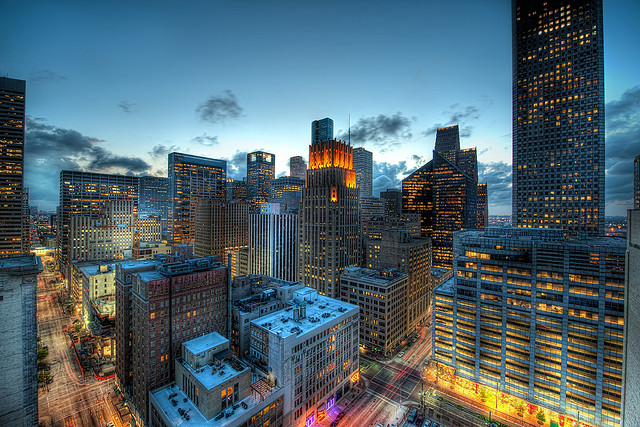
In a much smaller scale, that’s a very similar problem that a real estate investor faces when trying to decide where to invest their hard earned capital. A real estate investor may not spend millions of dollars on a property like Starbucks does, but relative to the investor’s means, this decision is just as crucial if not more. Even within a single market, like Houston, there are hundreds of different ways to put that capital at work. Does the investor put their money into cheap properties that are riskier but cashflow well or is it better to invest into premium locations that have higher appreciation rates but lower cashflow? What about a middle ground solution? And that’s not even all of it.…
Essential real estate investing lesson learned from Starbucks Read Post »